1. Discover your data
You can use the Executive Dashboard to retrieve data from cloud applications, files on your computer, cloud file sharing services, SQL databases, or even e-mail attachments.
Let’s say you want to track the popularity of your company’s Facebook page. All you have to do is connect your company’s Facebook account to the Executive Dashboard and create a data set (called a data source). You can then use this data source to create visualizations (these are called Klip and PowerMetrics). You can start following trends.
Do you need a unique data set? Write your own queries and create a custom data source.
Not sure how to write a query? No problem! The Executive Dashboard offers hundreds of pre-built data sources for the most common needs. For example, you can use Google Analytics’ built-in data source to get a monthly list of users, sessions, and pageviews for your business’s Google Account.
Do you simply want to build visualizations? Before creating the Clip and PowerMetrics, use the Modeler to edit the data sources. Modeling data sources makes it easier to understand and manage your data
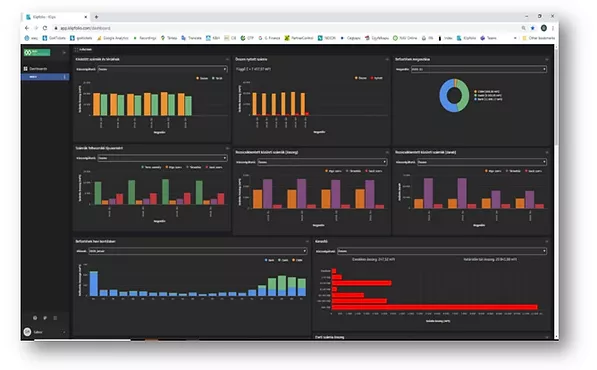
2. Present your data
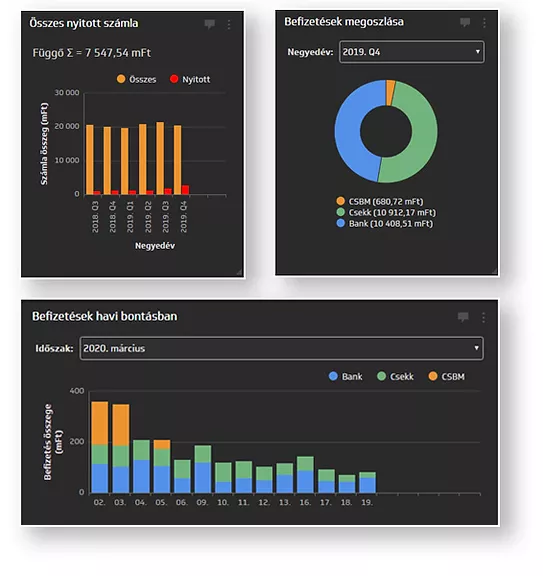
Visualize your data! Now that you have the data sources, it’s time to visualize the data, such as as a table or bar chart. There are several ways to display data in the Executive Dashboard, either as a Clip or as PowerMetrics on the Dashboard.
Clip: A clip is a visual representation of data, such as a pie chart, bar chart, or gauge. The clips present your data and are dynamically updated based on the frequency of the associated data source. You can use a pre-built Clip from the Clip Gallery, or build your own in the Clip Editor.
PowerMetrics: This is a value that is recorded over time, such as profit or regular monthly revenue. When you track key metrics for your business, you get ongoing access to current and past information, allowing you to make the right decisions at the right time.
Clip Dashboard: You can display your Clips on a dashboard, which you can then display on the big screens in the office or share with people and teams. This is a great way to combine similar content in one place. Create your own dashboard or view pre-made samples in the Dashboard Gallery.
PowerMetric Dashboards: The PowerMetric Dashboards display the associated PowerMetrics tools. These dashboards are highly customizable, allowing you to create custom displays tailored to your unique needs and audience. This flexibility allows data to be formatted for effective information and a clear display of business goals.
3. Share your data
Make your data popular! Encourage collaboration by sharing clips, dashboards, and PowerMetrics tools. Dissemination of data trends and results helps everyone move towards common goals, encourages debate and meaningful action.
On the Executive Dashboard, we can share our data in a variety of ways, including sharing a snapshot of the data (a static time at a time) or links to a dynamically updated view of the data. You can display control panels, clips, and PowerMetrics on large screens. this allows you to share the information with groups or individuals, in the Executive Dashboard account, or in the office at the same time.
4. Take action
Now that you have digestible data, what do you do with it? Monitor your data daily! The facts show that businesses that consistently track their data on a daily basis notice trends that immediately help them make effective decisions.
In Clips, you can set performance metrics that indicate changes in data, or compare historical values between different periods in PowerMetrics.
You can keep track of key data points so you can track your company’s progress. Take action in the real world – based on your own data!